Magellan Midstream: This Compounder Is On Sale
After my last article on midstream oil and gas companies, many of you reached out to me about what I actually own in the space. I have owned Magellan Midstream Partners (MMP) for the last couple of years, and due to some recent underperformance, I have been a significant buyer in the past month. Disclosure: My clients and I are long MMP.
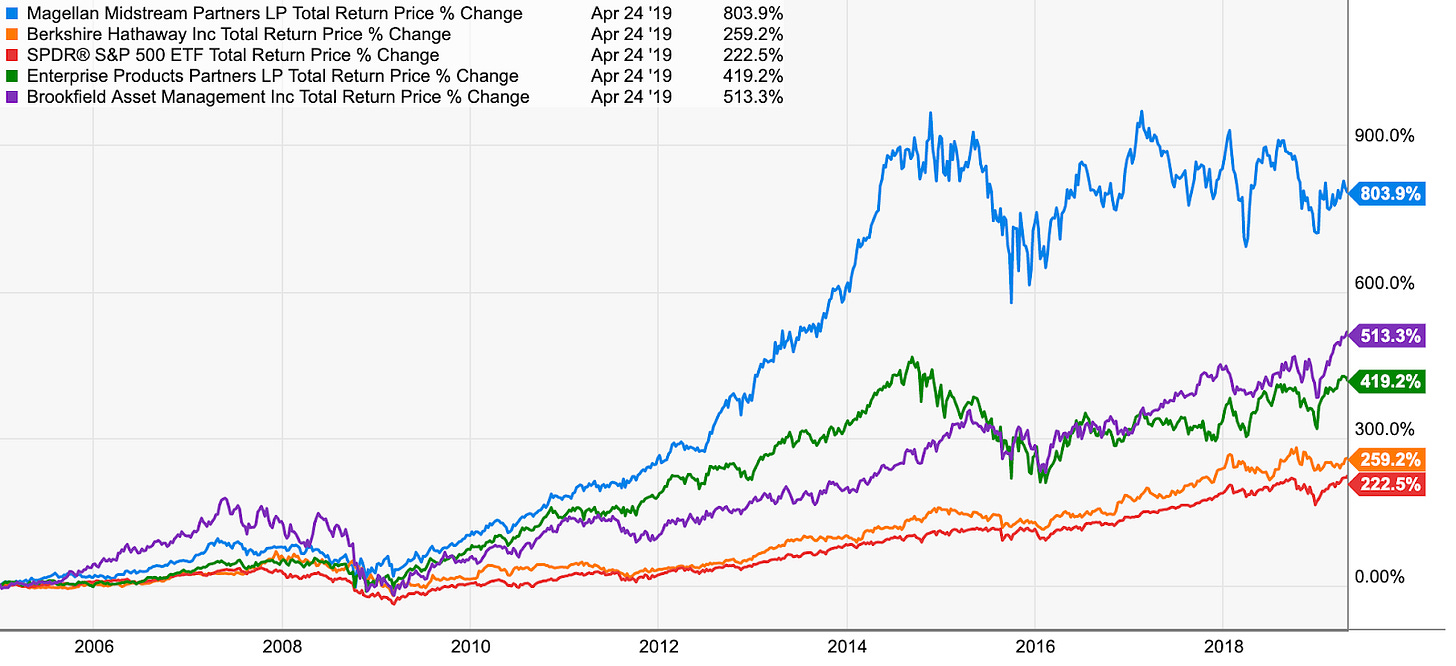
Magellan has historically been the best managed midstream company, with best in class ROICs, a very stable income stream, high returns on incremental capital, a large growth backlog, low and safe debt ratios, and almost no unitholder dilution over time. In short, Magellan has done everything that MLPs should have been doing all along. Due to all of these factors, the company’s units have returned 800% since the beginning of 2005, easily outpacing the S&P 500’s 223% return over that time period.
As we stand today, Magellan trades at an inexpensive price with a large backlog of growth projects that should generate 20%+ returns on incremental equity. I will go through the company’s asset base, value the assets that the company currently owns, then attempt to place a value on its future growth prospects.
The Details
If you haven’t read my previous midstream article, please read that now. It provides an important base for everything I’ll discuss here. In that article, I laid out some necessary conditions that I look for before investing in a midstream company. Let’s go through them one by one:
No IDRs - no IDRs at Magellan.
I don’t invest in drop downs - Magellan is not a drop down.
I must be aligned with management - management owns shares in the LP.
I want to own solid, fee based assets connected to major basins - more on this in a later section, but Magellan has high quality assets that have provided steady income through the cycle.
I want low leverage and no reliance on equity capital markets - Magellan has one of the lowest leverage ratios in the midstream space (a bit over 3x EBITDA) and has done one equity issuance in 2010, self funding all of its other growth projects.
Due to the potential for management abuse in the sector, it’s important that any investment that you look at passes a few initial screens. Magellan passes these easily.
The Business
After passing the governance and structural checks, it’s important to look at the quality of the underlying assets. This might seem like quite an obvious step, but I’ve personally been burned when I first started investing in the space because I didn’t focus enough on asset quality.
Magellan has three main business lines - refined products, crude oil, and marine storage. In 2018 they made up 59%, 34%, and 7% of the company’s total operating margin, respectively (all charts and figures are from their most recent investor deck). We will discuss each in turn.
Refined Products
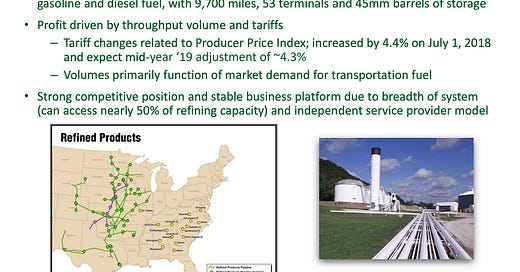
This is Magellan’s biggest segment, at 59% of 2018 operating margin. Here’s the relevant slide from their most recent investor presentation:
These are not the most exciting assets in the world, but they are quite solid. The storage assets and gulf connectivity are a nice complement to the pipelines, as storage is what lets a refinery optimize the feedstocks and end products to maximize profit, and gulf connectivity gives customers optionality on each molecule’s final destination. This is exactly the asset base that you like to see in a midstream company - lots of interconnection and optionality where the company is providing 2 or 3 end services to its customers. That provides higher value to the customer, which makes the customer more likely to use Magellan’s system and supports Magellan’s long-term earnings stream.
More broadly, as an infrastructure investor, whether that’s pipelines, railroads, toll roads, or cable systems, you’re mainly worried about two things. First and foremost, you’re worried about declining demand in the areas you serve. Second, you’re worried about competitor overbuild.
To address declining demand, I’m not going to go into a dissertation on long-term worldwide hydrocarbon use. I think a few broad points should suffice. First, projections even in a 2 degree Celsius climate scenario are for oil demand to be down at a low single digit annualized pace over the next couple of decades. We aren’t talking about demand dropping by half overnight, and anyone that understands the infrastructure constraints in moving to new fuels knows that that’s impossible anyways. Second, as an owner of Magellan, you’re worried about whether the oil and gas that is used worldwide is refined in the US. The US is blessed with the most efficient refineries in the world along with cheap export solutions. If we need less refining capacity in the future, it’s a good bet that that capacity will be located in the US and that those refineries will need Magellan’s storage tanks and pipelines.
The second worry is in relation to competitor overbuild. I tend to worry the most about overbuild when there’s some combination of ease of building, stratospherically high ROIC, and/or lots of very rapid growth.
In a refined products network, you don’t really have any of those things. Volume growth tends to be pretty flat, which means you don’t need lots of new pipelines to handle incremental demand. Addressing ROIC, Magellan has a run-rate of about $1.3 billion in operating income off of an $8.8 billion asset base. That gives ROIC of ~15%, which isn’t close to high enough for a straight overbuild on flat volumes. Last, if you’re trying to build a pipeline anywhere but Texas, you’ll find that it’s anything but easy. On top of all that, if you just build a pipe from A to B that doesn’t really compete with an integrated refined product network that has storage, export, and other logistical capacity.
These are good, if unspectacular assets, that should provide relatively stable cash flow. Due to all of the factors I just explained coupled with the fact that these aren’t high growth assets, I expect flattish volumes along with small price increases over time, leading to a bit of organic earnings growth.
Crude Oil
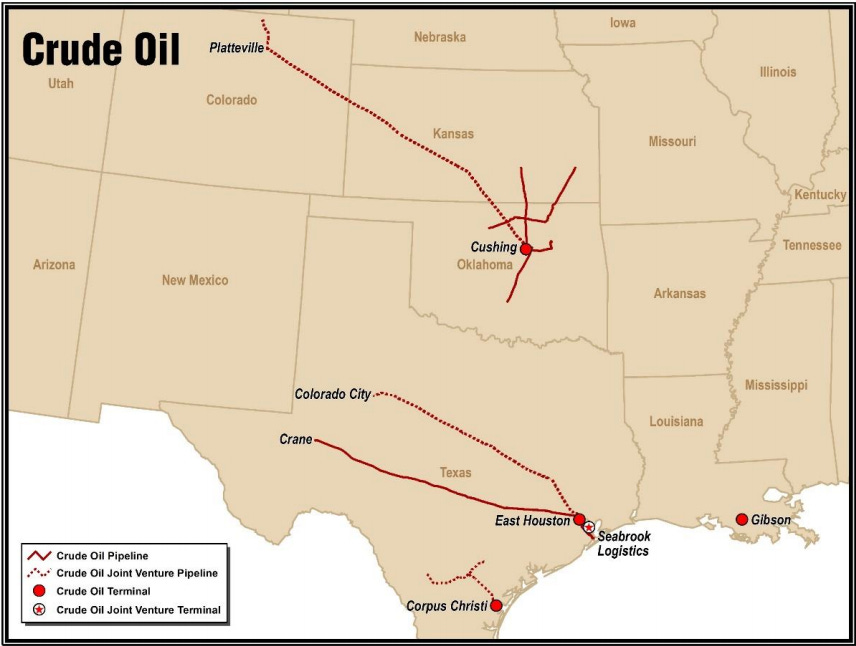
This segment contains Magellan’s crude oil pipelines. These pipelines primarily ship oil from the DJ, Permian, and Eagle Ford basins to Cushing, OK and to the gulf coast.
We saw that Magellan’s refined products pipelines would generally be difficult to overbuild. These pipelines, on the other hand, are certainly subject to competition. The Permian Basin has had prolific growth, necessitating multiple new pipelines for takeaway capacity. New pipeline capacity creates competition with old pipeline capacity, which can lead to lower volumes and/or lower tariff rates. Furthermore, since the Permian Basin is in Texas, getting those new pipelines permitted and completed has been fairly easy. Counterintuitively, having good assets in a great basin in a state with a friendly regulatory environment can actually make business tough.
While these pipelines do have more competition, that doesn’t mean that they’re terrible assets. Magellan, along with Plains All American, sold part of its interest in one of their pipelines out of the Permian Basin for roughly 12-14x Magellan’s estimate of long-term EBITDA (numbers provided directly from IR). They clearly are good assets that provide good cash flow; it’s just that you can’t count on perpetual high volumes and rates over time.
I do like that Magellan’s management has taken a bit of money out of its crude pipeline business. They sold part of their interest in one pipeline, as I just mentioned, and they recently canceled plans to participate in construction of another Permian crude pipeline.
Marine Storage
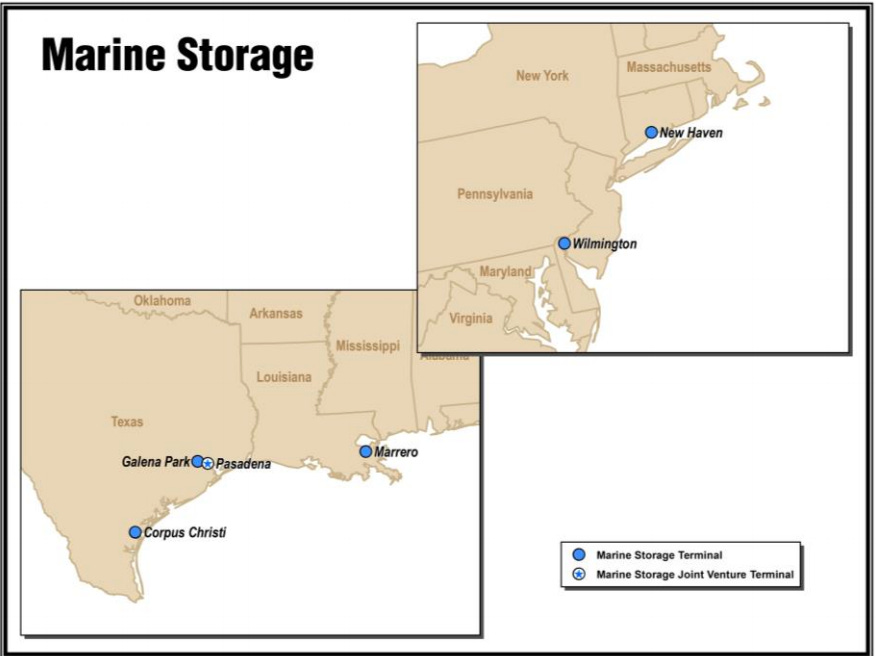
This is Magellan’s smallest segment, at only 7% of total operating margin, although some projects that are currently under construction will take that number up next year. Here’s a map showing the locations of these storage facilities:
I generally don’t love independent storage assets, but importantly the bulk of this business provides interconnection to Magellan’s other businesses, which turns them into important assets. That connection adds value to the system as a whole which makes them quite valuable.
Bringing All The Assets Together
In midstream, you want the assets to come together so that they’re worth more than the sum of the parts to your customers. You want interconnectedness and to touch each molecule more than once. In the previous section, you can see that these assets are interconnected, but I think a passage from a recent press release for a potential growth project sums it up best:
This project would bring oil from a Magellan owned pipeline to a Magellan owned storage facility through another Magellan owned pipeline into a Magellan owned distribution system to an end refinery customer. That integration is key to long-lasting value creation in the midstream space. Without it you just have a bunch of dumb pipes that go from A to B that are subject to competition and declining earnings.
Valuation
When valuing a midstream company, I use a 2 step process. First, I value the assets that are currently in the ground. Second, I estimate the NPV of growth capex.
Valuing What’s In The Ground
What I’m looking for here is a run-rate TTM number for earnings from the assets that the company currently owns. If an asset has been sold in the last 12 months you need to deduct the earnings that haven’t flowed out of the income statement from your TTM number. Alternatively, if an asset has been put into service you need to add an estimate for its contribution to earnings.
For Magellan, the biggest adjustment is to back out the earnings from the portion of BridgeTex that they sold last year. I estimate that BridgeTex contributed ~$35 million in EBITDA to Magellan’s TTM numbers, which needs to be deducted. I’ll also add an estimated $8 million in EBITDA for their Seabrook Logistics project that was completed mid-year in 2018.
To value this, I’m going to find TTM EBITDA, convert that to FCF, then put a discount rate on it.
Magellan’s reported TTM EBITDA for 2018 was $1,396 million. Making the aforementioned adjustments for BridgeTex and Seabrook we get EBITDA of $1,368 million. There were also a few costs that might not be characterized as run-rate included in that EBITDA number. There was $16 million in Q1 for an actuarial mistake that they caught, $2 million in cost from Hurricane Harvey in Q2, and $18 million of cost in Q4 evenly split between the shutdown of a small ammonia pipeline and the cancelation or modification of a growth project.
I’ll let you come to your own conclusions on whether or not to adjust those out. I do make those adjustments, so I get a true EBITDA run-rate of $1,404 million. If you want to look through their history and take an average of these other expenses, you’d find that it won’t really change your conclusion on the valuation.
Now we need to map from EBITDA to free cash flow. This is relatively easy for a pipeline company, as they give you all the inputs you need. Maintenance capital is ~$95 million and interest expense is ~$190 million. Since Magellan is an MLP, it doesn’t pay corporate tax. After deducting capex and interest we get free cash flow of $1,119 million.
What is that cash flow stream worth? I use a 10% discount rate. Going back to our previous discussion on the individual assets, I think it’s fair to assume that these assets grow their earnings in the range of 2% over time. That gets you a fair value of ~$61 / share. Translating that back to EV / EBITDA you have a multiple of ~13x.
Valuing The Growth
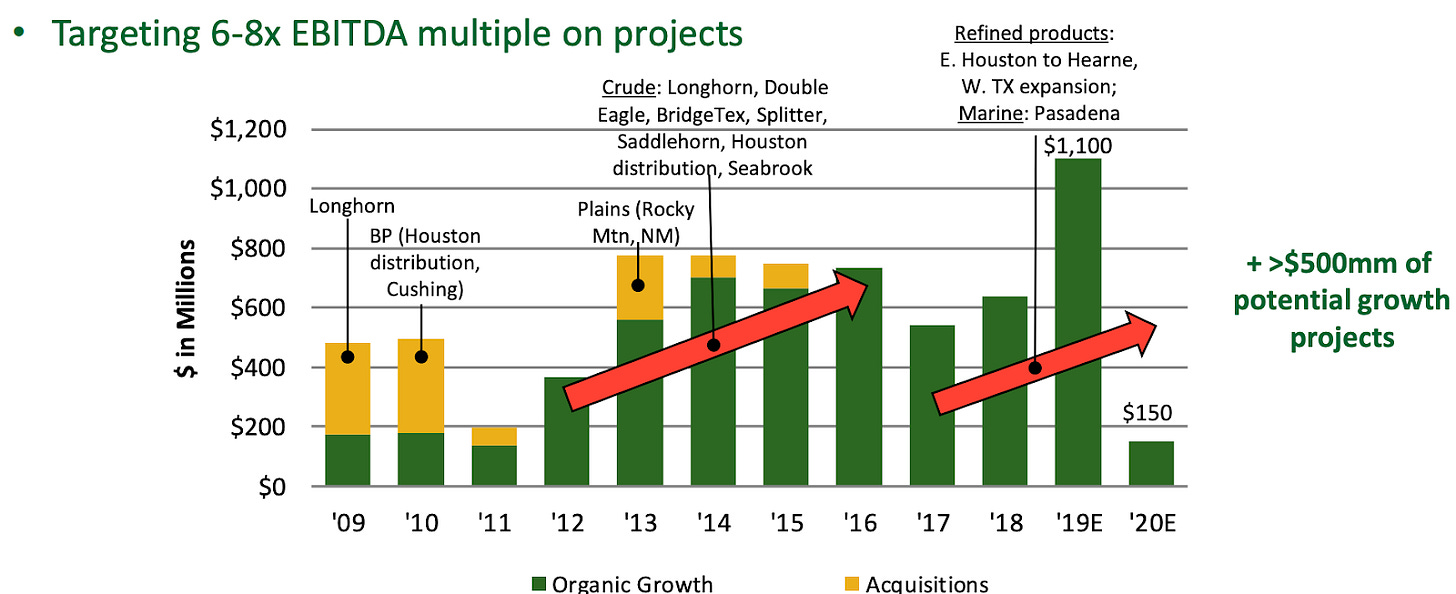
The last piece in the valuation is to value the growth opportunity. This is, obviously, more uncertain, so I’ll try to find a range of possible values. Here’s a chart showing Magellan’s historical growth spending and target returns:
You can see that over time they have significantly increased their spending on growth capex (they’ll certainly spend more than the $150 million they currently have committed for 2020) as the company has gotten larger. To keep this analysis simple, I’m going to run two scenarios where Magellan spends $500 million per year and two where it spends $1 billion per year.
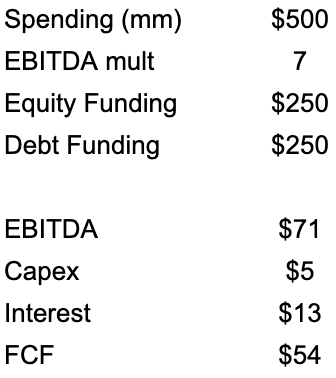
With the company’s target returns of 6-8x EBITDA, we can map this spending down to FCF and value it just like we valued the assets in the ground in the previous section. First, let’s assume that the company builds growth capex projects at a 7x average EBITDA multiple. Here’s how the cash flow would waterfall:
My assumptions are as follows: 7x EBITDA multiple, debt funded up to 3.5x debt / EBITDA multiple, maintenance capex at 7% of EBITDA (slightly higher than the current percentage), and a 5% interest rate.
After all of that, we spent $250 million of equity to generate $54 million of FCF. Using our previous estimate of 2% growth over time for these assets and a 10% discount rate, Magellan would have created $425 million in value for the year (i.e. $54mm / (.1-.02) = $675mm - $250mm in equity invested).
If we assume that Magellan spends $500 million annually at those same returns forever, we’d have value creation of $425 million annually, which would be worth $4.25 billion, or $18.6 / share at that same 10% discount rate.
We can extend this analysis to other scenarios. The biggest variables are annual capex spending and the construction EBITDA multiple. If I do the same analysis with both $500 million and $1 billion in annual spending and both a 7x and 8x EBITDA multiple, here’s the NPV of the growth on a per share basis:
Adding It All Up
We can take the value of the assets in the ground and add the value of the growth to it to find a consolidated value. We had $61 / share of value for the assets that are in the ground, so using a value for the growth somewhere in the middle of the range we found would easily get us to $80 / share. With Magellan at ~$60 as I write this, there is clearly value in the units.
Factoring In Funding
It’s quite clear to me that Magellan looks inexpensive at current levels. I chose to do the 2 step approach of valuing the assets in the ground because it matches up nicely with the current market price - the current assets cover the market price and the growth should add nicely to value on top of that.
There are two additional considerations when thinking about growth capex for midstream companies. First, I just assumed constant growth capex spend over time. Obviously, as a company gets bigger, it should have more growth opportunities, so you’d expect growth capex to climb over time. Second, you always need to have a clear view on how they’re going to fund the growth. The economics change significantly if it’s funded by equity or preferred issuance. Even though Magellan has historically stayed away from doing this, I want to go through a model so you can get a sense of how everything might be funded.
We’ll address both of these problems at once by creating a model that assumes that all retained cash flow above the distribution (i.e. DCF - distributions) is used to fund the equity portion of growth capex. Doing it this way will ensure that the company can fund its growth and will assume increased growth capex over time as income increases.
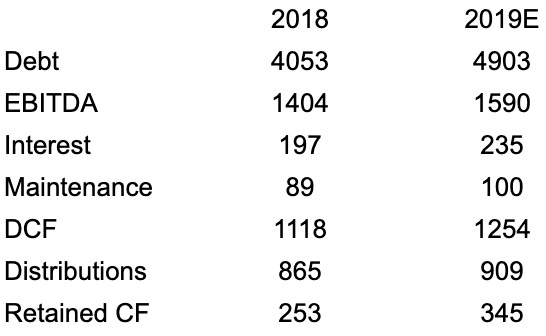
Here’s a chart with the run-rate metrics from 2018 that I’ve referenced along with my estimates for run-rates at the end of 2019.
I want to stress that these numbers are run-rates, not actual numbers, because I’m looking at TTM earnings power of the assets currently in the ground. Magellan will be putting three big projects into service in 2019 and the income of those projects will take a while to flow through the financials.
For my 2019 number, I’ve assumed 2% organic EBITDA growth, a 7x capex multiple for the Seabrook Logistics expansion, the quoted 9x multiple on the Pasadena Terminal project, and the quoted 8x multiple on the Houston to Hearne pipeline (all info from the same investor presentation). These projects should be completed in 2019.
I’ve also put in the proportionate contribution from the West Texas refined products pipeline (i.e. $350 million spent by EOY 2019 at a 7x multiple) even though it won’t be finished until mid 2020, as I figured it would just be easier to do the whole analysis at EOY 2019. Last, I’ve assumed distributions increase by 5% as management has indicated.
I’m going to look at how Magellan can fund growth capex as of EOY 2019 so that I can build out a simple model. We could use 2018 but 2019 is a big growth year so I prefer to use 2019 then discount it back. Magellan has guided for ~$909 million in distributions over the next year. At EOY 2019 the company should have $345 million of run-rate cash flow on top of that $909 million that it can use to fund growth projects. We know that if the company builds new growth projects at a 7x EBITDA multiple and if they use 3.5x EBITDA leverage then those growth projects will be 50% equity funded and 50% debt funded.
Instead of picking a random number for growth like we did in the previous section, let’s say that Magellan uses all of its retained cash flow of $345 to fund growth projects. That would mean that in 2020, Magellan could fund $690 million of growth projects (i.e. $345 million funded by debt and $345 million funded by equity). That would generate $99 million in incremental EBITDA and $74 million of additional free cash flow. The next year, it would have even more retained cash flow, which it could use to fund even more growth. Here’s how it would all look:
All I’ve done is assumed all retained cash flow is able to be spent on capex at a 7x EBITDA multiple then extended all of the other metrics. The total growth from 2019 onwards, assuming this level of reinvestment along with 2% organic growth, is a bit above 8% annually.
Instead of trying to put that into a DCF valuation, I’ll just say that you’ll have a cash flow stream of $909 million next year that’s growing by a bit over 8% annually and with a long runway. The current market cap is ~$13.9 billion, which gets you a 6.5% current yield. If you add the yield to the growth, you get a bit under 15% IRRs without factoring in valuation changes.
The clearest situation in which you wouldn’t get close to that 15% is if Magellan couldn’t find enough accretive growth projects to fuel that growth. If you said that Magellan could only find $250mm of growth projects per year to start and that growth scaled with EBITDA like we just assumed, then you’d have room for $1,186 million in distributions in 2020 (which would leave the required $125 million of cash flow to fund growth capex of $250 million) and you’d be growing EBITDA and earnings at ~4-4.5%. That would get you to a ~12-13% IRR before taking valuation change into account. That’s not 15%, but that’s not bad either.
Why Has It Underperformed?
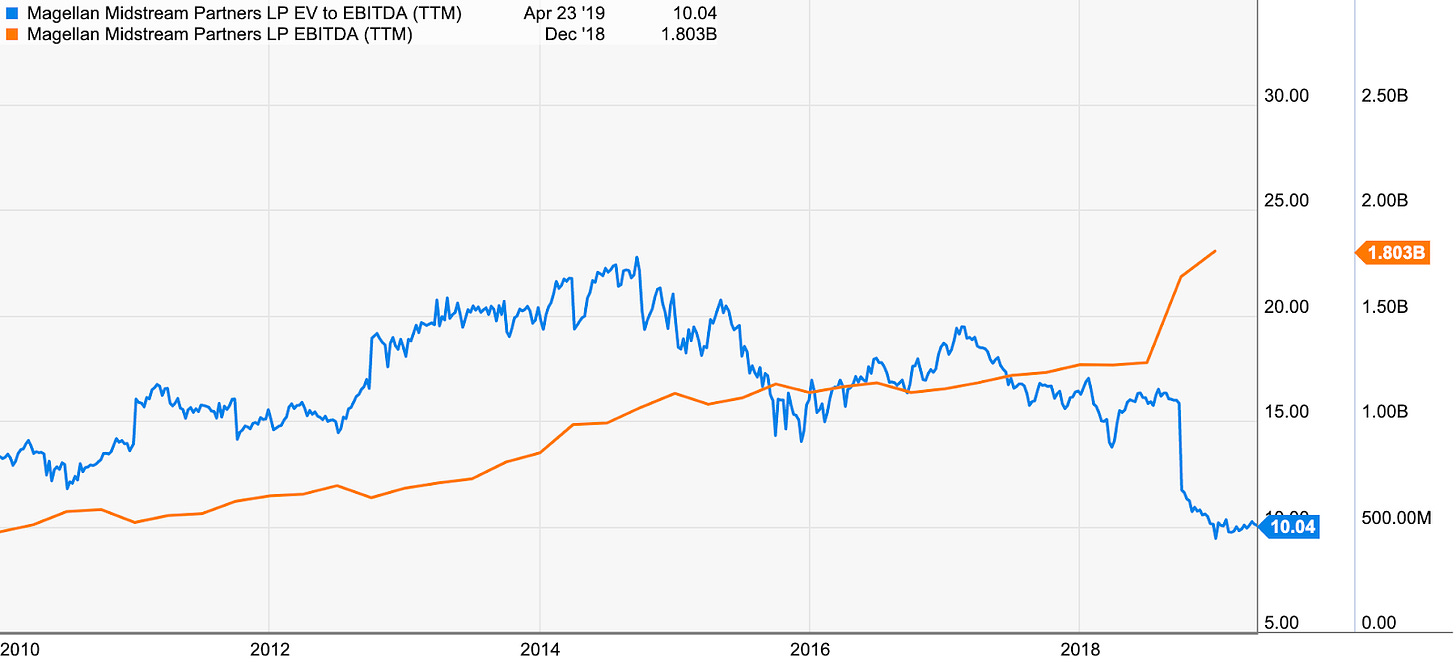
I get this question a lot. The stock is down from ~$90 to ~$60 since 2014, which makes some investors wonder what the problem is, especially since this is such a high quality company. Was there really some kind of disaster that I’m glossing over? If you look at a chart of Magellan’s valuation, you’ll quickly see the culprit:
Magellan traded at 23x EBITDA in 2014! That’s insane for a pipeline company! The end of the chart is inaccurate due to the aforementioned asset sale, but the valuation is ~13x as of now. While the company steadily grew EBITDA and earnings, it just took a long time for the intrinsic value to catch up to the price. At 23x you were assuming huge growth and a super low discount rate. At 13x you’re assuming no growth, as I’ve shown in previous sections. You can see that the last time Magellan traded at a similar valuation was in 2010 when markets were still reeling from the Great Recession.
Are Other Midstream Companies Cheap, Too?
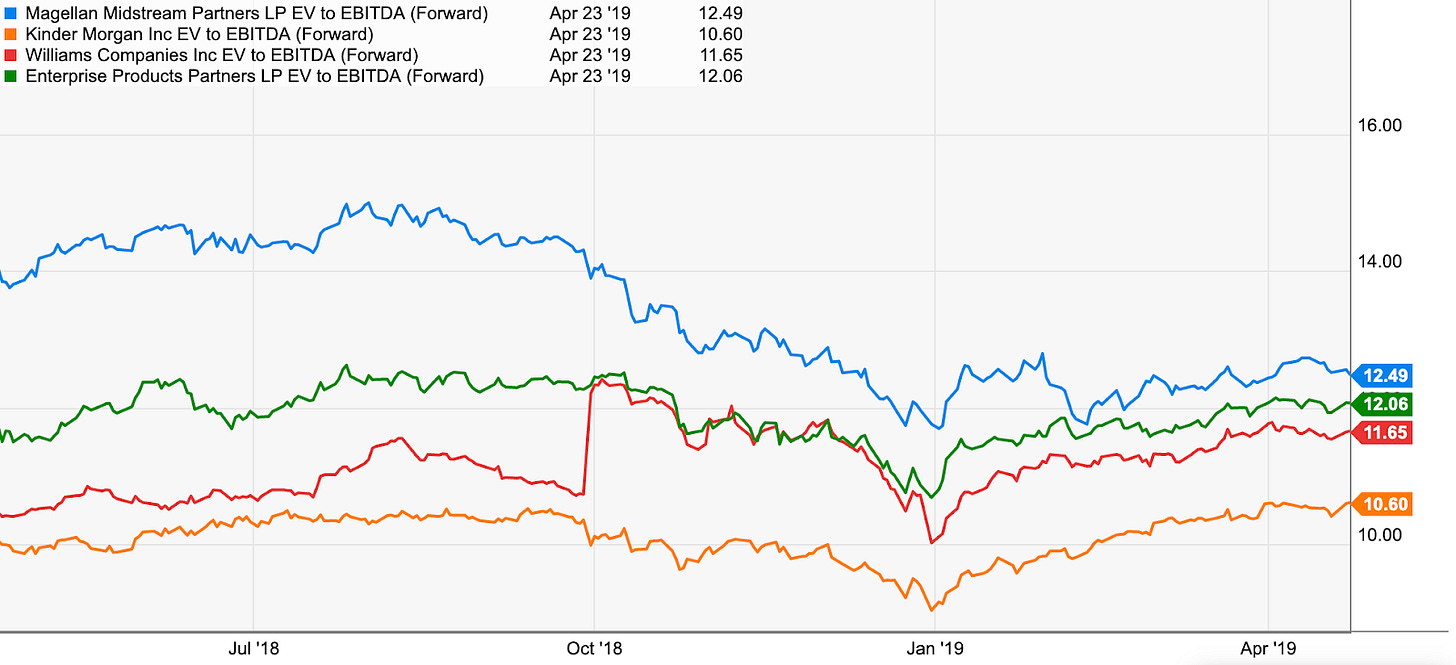
One important additional caveat is that most of the big companies in the midstream space look quite attractive to me at current levels. I think a long-term investor can make low double-digit or better IRRs in a few of the bigger names. Here’s forward EV / EBITDA for Magellan, Kinder Morgan (disclosure: some clients are long), Enterprise Products, and Williams:
EV / EBITDA isn’t the perfect metric, as you need to deal with minority ownership and some other things, but more broadly all of these companies look quite cheap to me and they generally have good assets. I expect good EBITDA and earnings growth over time for each of these companies, and I think the valuations are too low.
That said, I prefer Magellan at these levels because it should grow faster than these companies over the long-term and it also has the lowest leverage metrics and in my view lowest long-term risk in the business. You used to have to pay up considerably for that growth and lower risk profile, but you can see from the previous chart that Magellan’s valuation premium has compressed quite considerably compared to peers over the last year. At this point, I think Magellan has the lowest risk compared to its big peers and might even offer the highest long-term return.
Final Thoughts
Magellan has been the best performing MLP over the last cycle by doing all of the simple things right - it has kept low debt levels, focused on fee based business, maintained capital discipline, and executed on its attractive growth projects. The results have been quite stunning:
By sticking to its simple business model, Magellan has significantly outperformed the S&P 500, Berkshire (disclosure: long), Enterprise Products Partners (its closest peer), and even Brookfield Asset Management (disclosure: long) over the last economic cycle.
We know that this is a very high quality business. Now, for the first time in a long time, you don’t need to pay up to own it.
[jetpack_subscription_form show_only_email_and_button="true" custom_background_button_color="undefined" custom_text_button_color="undefined" submit_button_text="Subscribe" submit_button_classes="undefined" show_subscribers_total="false" ]
Disclosure: Pursuant to the provisions of Rule 206(4)-1 of the Investment Advisors Act of 1940, we advise all readers to recognize that they should not assume that recommendations made in the future will be profitable or will equal the performance of past recommendations. This publication is not a solicitation to buy or offer to sell any of the securities listed or reviewed herein. This contents of this publication are not recommendations to buy or sell any of the securities listed or reviewed herein. Investing involves risk, including risk of loss. The contents of this publication have been compiled from original and published sources believed to be reliable, but are not guaranteed as to accuracy or completeness. Kyler Hasson is an investment advisor and portfolio manager at Delta Investment Management, a registered investment advisor. The views expressed in this publication are those of Kyler Hasson and not of Delta Investment Management. Kyler Hasson and/or clients of Delta Investment Management and individuals associated with Delta Investment Management may have positions in and may from time to time make purchases or sales of securities mentioned herein.
