Midstream Energy: Scary Looking Backwards, Too Cheap Looking Forwards
Disclosure: my clients and I are long Kinder Morgan (KMI) and Magellan Midstream Partners (MMP).
Midstream energy has gotten a bit of press recently, perhaps because the sector has had a nice bounce this year after a long bout of underperformance. I have had a large position in midstream energy names for the last year or two. I believe that these are good businesses that are trading way, way too cheap. Most investors balk when I bring up midstream companies, which makes sense because the valuations imply that no one wants to own them.
For those that don't follow the oil and gas value chain, midstream energy companies mostly own assets that store and transport hydrocarbons. This is as opposed to upstream companies that explore for and recover hydrocarbons and the downstream companies which refine feedstocks into end products.
These transportation and storage assets tend to have much less cyclical cash flows than exploration and production assets, since these cash flows depend relatively less on commodity prices and more on fee charges for said transportation or storage. A few years ago, up until oil and gas prices crashed, these stable cash flows made midstream energy names the darlings of income oriented investors. Midstream stocks offered steady income streams, high payout ratios, and numerous growth projects easily financed by wide open capital markets that would push up earnings over time. Compared against interest rates near 0%, investors bid up midstream shares, which led to outstanding long-term performance for the sector.
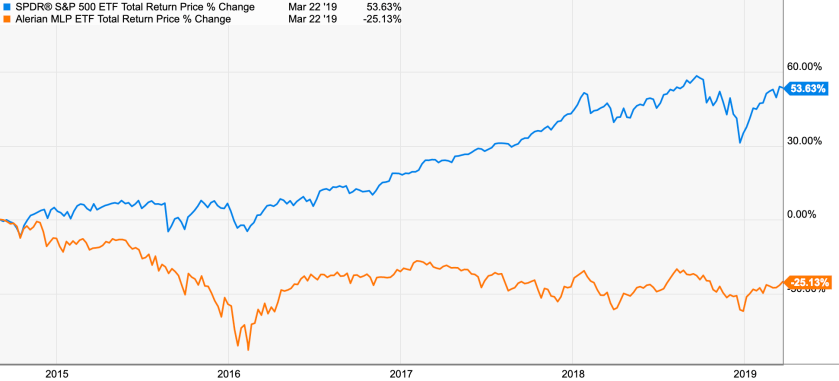
This story supported unit prices for a while, but once oil prices started to move lower in 2014, MLP units promptly crashed. Look at performance from the peak on September 2, 2014 until today:
Midstream energy companies, which were thought to be immune from commodity prices, have lost 25% of their value while the S&P 500 has gained 54%.
When you see underperformance of this magnitude, it is usually because of a shift in the investment narrative. During the boom times, midstream energy companies were considered income vehicles that would raise distributions every year, which were suitable to anyone who needed current yield. The valuation of the assets was secondary. Now, MLPs are perhaps the most despised niche of an already-hated energy sector.
For value investors, it is important to understand this narrative shift and the reasons for underperformance. After the price drop, do midstream energy companies currently contain important assets and offer good value? Or are these companies part of a doomed asset class that is simply part of the way towards correcting overvaluation? In order to answer these questions, we will take an overview of energy infrastructure structures, examine what caused the price crash in 2014, and look at what returns might look like going forward.
Digging into the Structure
Retrospectively, it is clear that energy infrastructure isn’t a magic asset class whose dividends grow to the sky. Current operating assets’ income can fall, and there isn’t always capital to fund growth. The narrative from 2014 was clearly wrong.
In order to cut through the previous narrative and understand exactly what these businesses encompass and how they work, let’s look at what kind of assets these companies own, how they are funded, how they historically compensated the general partner, and how they set capital allocation.
Assets
These companies own a variety of assets. I’ll break these into “core, fee-based assets” and “non-core, margin-based assets.” Core, fee-based assets are usually what investors think of when they consider a midstream oil and gas company – pipelines that move oil from a production basin to a refinery, gathering systems and pipelines that aggregate natural gas and move it to a utility or chemical plant, or oil tank terminals that store hydrocarbons for refineries so that the refineries can respond quickly to market conditions. All these assets are essential for the oil and gas value chain – without them, oil and gas fields and refineries would be worthless as they would have no outlet or access to hydrocarbons, respectively.
What I think of as non-core, margin-based assets can consist of pretty much anything else. Plains All American had a supply and logistics business that basically arbitraged price differentials around the country. Many companies had facilities that bought a feedstock, blended different chemicals into the feedstock in order to turn it into another material, then sold that material at the market. In both these examples, money is not made from transporting or storing hydrocarbons for a fee. Instead, profits (or losses) are made from price differentials between locations or products. These can be okay businesses, but an investor must understand that the earnings streams are quite volatile.
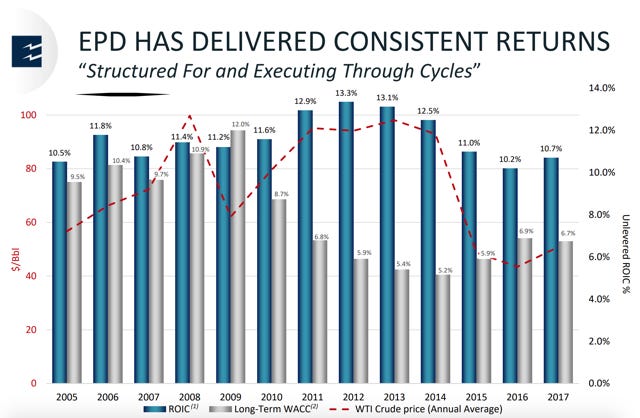
Most energy infrastructure companies are some blend of these core, fee-based assets and other, margin-based assets. That is, obviously, a generalization. Some companies have much more fee-based exposure than others. Despite their differences, on an aggregate basis these assets usually earn a low- to mid-teens ROIC (I define this as [adjusted EBITDA - maintenance capex] / [net current assets + long-term tangible assets + depreciated portion of PP&E])[ and generate fairly steady returns. As an illustration, here is a chart from Enterprise Products Partners’ investor presentation showing returns on capital over the last 13 years:
Enterprise has an asset base that is high-quality and more stable than normal, so other companies could have more variability, but this gives you a good idea of what to expect from these assets over time – good but not great unlevered returns on capital with moderate cyclicality in those returns.
Funding
Now that we have a handle on the assets, the next step is to examine how they are typically funded. They are usually funded with a mix of equity and a hefty amount of debt, since they are long-lived and fairly stable assets. Many of these companies finance their projects with debt at around 4-5x their EBITDA.
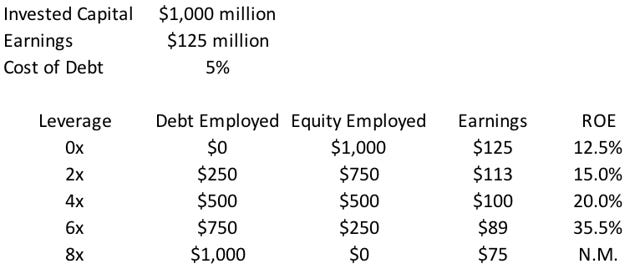
To help visualize this, imagine a company that has $1 billion of assets earning on average a 12.5% ROIC (close to the average seen in the previous section), which produces unlevered earnings of $125 million per year. Now let’s add on some debt. Here’s a chart showing equity employed, debt employed, and return on equity (ROE) as a function of leverage for that hypothetical company:
As the debt employed increases, ROE increases significantly as the equity portion of capital employed decreases. Because of this, and because these infrastructure assets are relatively long-lived and stable as previously mentioned, many of these companies do feel comfortable around 4x leverage. Some are comfortable at materially higher leverage multiples.
General Partner Payment
Payment to executives is extremely important in the energy infrastructure space. While many of these companies have converted from limited partners (in the form of MLPs) to c-corps, a discussion of how things used to work is important to help explain how energy infrastructure companies' shares got hammered a few years ago.
Most energy infrastructure companies used to be listed as limited partnerships. As a limited partnership, MLPs are / were controlled by their general partners (GPs); oftentimes, management owned a large stake in the GP, making it essential for investors in the LPs to understand the compensation structure.
In most cases, the MLP paid incentive distribution rights (IDRs) to the GP. These payments are structured in order to reward growth in distributions per unit. IDRs were usually structured before the IPO of the MLP and wouldn’t kick in until the quarterly payment had been significantly increased from the time of the IPO – this gives management an incentive to grow the distribution per unit. Usually, beyond the payment hurdle the MLP will pay half of incremental distributions to the GP. Importantly, since most of these companies had been public for many years, they were paying distributions to their GPs of half of incremental cash flow over the hurdle rate.
Imagine the same company we looked at earlier with $1 billion in invested capital and a 12.5% ROIC. Assume this company uses 4x leverage, so that its ROE is 20%. Now assume that the IDRs kick in once earnings hit $100 million. If this company builds a new growth project for $100 million with all the same attributes (12.5% ROIC, 4x leverage, 20% ROE), then it will have $20 million of incremental earnings. If it pays half of these incremental earnings to the GP, then the MLP will get $10 million of cash flow while the GP will also get $10 million. To be clear, the MLP must put up the $100 million for the project while the GP puts up nothing, so the MLP’s ROE is 10%.
While IDRs were quite common, most MLPs have eliminated them for the obvious reason that they halve the MLP’s ROE for expansion projects. Where they have been eliminated, the GP has traded its right to IDRs for additional ownership units of the MLP itself. It is vitally important to understand the IDR structure, or lack thereof, for any company that you’re looking at.
Capital Allocation
Generally, energy infrastructure companies have two options for the cash generated by the business: distributions to shareholders and growth capital expenditures. As shown above, they can earn attractive returns on incremental equity employed, and so many spend significant sums to put growth assets in place in order to grow their earnings power and distributions over time.
Looking at the shareholder distributions side, these companies usually set their payouts to their investors at a percentage of their distributable cash flow (DCF). DCF is a pipeline company's version of free cash flow, and is roughly calculated by subtracting maintenance capex, interest, and taxes (if any) from EBITDA. The reasoning is intuitive – once they pay to maintain their assets and pay interest and tax, all cash flow left over is available to the owners.
With our hypothetical company, earnings are equal to DCF, since I defined ROIC as EBITDA minus maintenance capex and further subtracted interest to get to earnings. Let’s use our base case of 4x leverage to examine capital allocation – in this case we have $100 million of earnings to put to work.
Most energy infrastructure companies try to find a balance between high payouts and growth. With this company, if they were considering the aforementioned $100 million project, they would need to come up with $50 million of debt and $50 million of equity if they financed it at 4x leverage.
If our company paid out its entire DCF to investors, it would need to sell stock in order to fund its $50 million non-debt portion, since it would have no leftover cash flow. Alternatively, if the company only paid out $25 million, it would have $25 million left over. Most companies balance payouts and growth by paying out a large portion of DCF, say 75%. They use the leftover 25% to fund growth, and if needed they will often issue incremental equity to fund that growth. If our company paid out 80% of $100 million, as an example, it would fund its $100 million in growth capex with $50 million in debt, $20 million in retained earnings, and $30 million in stock issuances to cover the balance.
What Caused the Crash?
Now that we have covered the important aspects of the energy infrastructure business model, we are ready to examine why they have underperformed so significantly since 2014. In some cases, a large drop in market prices is a reaction to assets that are justifiably no longer needed – think of something like Blockbuster, for example. In other cases, the market is simply correcting an overvaluation, too much leverage, and/or moderately weaker earnings. In the former case, you can be looking at a value trap. In the latter, you can often find market overreactions and significant value.
Looking back on the assets themselves, it is clear that many energy infrastructure companies have very valuable asset bases. The problem with the stocks was overvaluation paired with too much leverage and weaker than expected cash flow, which combined to turn the prior narrative of ever-expanding dividends on its head.
It is important to revisit the narrative from 2014 to see why it failed. Energy infrastructure was viewed by investors as a good way to make income at a time when interest rates were effectively at 0%. Investors rewarded large and growing dividends – if you could buy one of these companies that yielded 3.5% and the distribution was projected to grow every year by 5-7%, then isn’t that better than getting 0.01% on a money market or 0.58% owning 2-year treasury bonds?
During this time, in order to increase their distributions and thereby make the units attractive to investors, many of these companies paid out as much of their income as they could in the form of dividends. Some paid out close to 100% of their DCF. They would fund projects with as much debt as they could in order to lessen the need for incremental equity invested. Finally, since they weren’t retaining much cash flow for growth, they would sell equity in order to fund those growth projects.
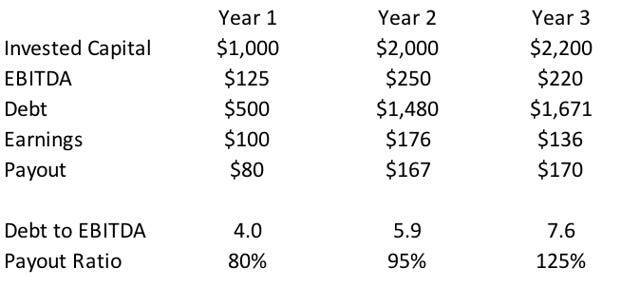
Let’s look back at our hypothetical company: it has $1 billion in assets, $125 million in EBITDA, is 4x levered, earns $100 million, and pays out $80 million. Management understands that the market cares most about distributions, will reward higher distribution growth, and will generally ignore debt and coverage ratios, so they decide to move towards 6x leverage and a 95% payout ratio. Look at what they can achieve:
During year 1, with all the extra debt capacity, they decide to double their asset base through growth investments and therefore double EBITDA. Debt almost triples, but due to incremental earnings it only goes up to 5.9x EBITDA, close to their 6x target, which is considered reasonable. In order to really juice the valuation, which is based on the distribution yield, they pay out 95% of earnings instead of 80%, meaning that the distribution has more than doubled. The market loves the growth, along with the prospect for future growth - remember the distribution doubled this year, so it should keep growing quickly! - and rewards the company with a higher valuation, indicated by a lower dividend yield, than when it started. The yield goes from 5% in the beginning to 4% after the transformation, to take the perceived extra growth into account. As a result, the stock returns 175%. The next year, management plans to increase assets by $200 million, or another 10%. The company funds this with $150 million in debt (6x the expected EBITDA from the new assets of $25 million), $10 million in retained earnings, and sells $40 million in stock. With the stock yielding 4%, they don’t need to sell much.
Astute readers, along with anyone who witnessed what happened, know how things went so very wrong: the cycle turned and took ROIC and earnings down. Look what happens if ROIC goes from 12.5% down to 10%, which is around what happened to Enterprise Products. Remember they have some of the best, most stable assets in the energy infrastructure universe, and other companies saw earnings drop even more than this:
After a small decrease in earnings, the key health metrics are clearly demolished due to the leverage and high payout ratio. The company is now shut out of the debt market due to the stratospheric leverage, and indeed they’re in breach of their covenants so they must actually pay down debt. Creditors, now thinking more sanely, would prefer debt to be no more than 5x EBITDA, so the company needs to pay down $571 million. The distribution is 129% of earnings and must be drastically cut by 50%. Since the company is an “income stock” and trades based on the distribution, the share price gets hammered and goes down well more than the 50% distribution cut. If the company wants to sell equity to pay down debt or pay for growth, it must do so at distressed levels, meaning that equity issuance destroys value for shareholders.
The only real option, even after cutting the distribution 50%, is to sell assets – it can only pay down $50 million of debt per year even assuming $0 in growth capex. A wave of asset sales pushes down prices and panic selling at the bottom further destroys value. In short, there are no viable ways out.
If you notice, I didn’t even include the impact of IDRs – that makes the math much bleaker. The story of what happened is clear enough.
Looking for Value
After all that has happened, where do we stand now? As I mentioned earlier, shares are down massively from their peak, but the key question is whether there’s any value left in these companies. Is the large drop in the unit prices a sign of a further free-fall towards irrelevance or bankruptcy? Alternatively, have prices simply corrected to a new fair value, after taking the drop in earnings and leverage into account? Or is there some real value here?
If we’re going to look at value, we need to value these companies traditionally and based upon their current cash flows and conservatively projected growth rates. It’s not good enough to say that an energy infrastructure company yields 7% and that’s better than the market, so it’s a good investment. That’s the exact kind of thinking that got these companies into trouble in the first place - investors looked at yield spreads and ignored the actual value of the assets.
Here are the factors and considerations that I personally look for when trying to find good investments in the space:
I absolutely do not invest in an anything with IDRs. As we saw above, it’s very hard if not impossible to earn even decent returns on incremental equity when you put up the investments yourself and pay half of the profits to the parent. If incremental projects earn a 10% return for the MLP itself, then growth is destroying value if I have a low-teens hurdle rate. In addition, IDRs skew incentives for management – they reward absolute growth and not intrinsic value growth. Those are two very different things. Luckily, many of these companies have traded IDRs for an increased stake in the shares for the GP, thereby removing the IDR overhang to ROIC and also directly aligning management’s incentives with normal investors’.
I must be aligned with management. If management owns, say, shares in a GP, then I'm not going to own shares in the LP. Energy infrastructure investors have taken a beating historically because of all that I've written about but in many times also because they weren't aligned with management.
I prefer fee-based assets connecting to major basins. This promotes stable cash flows and ensures those cash flows will hold up better than most during a down cycle. Earnings for many fee-based assets have actually gone up over the past few years, even in the depths of the oil and gas cycle. Asset quality across these companies varies considerably, and investors need to take this into account.
I value low leverage and low payout ratios. The combination means that the companies will be fine if earnings drop further. Importantly, they also won’t be reliant on capital markets in order to fund growth capex, which is essential if unit prices continue to be depressed.
I don’t consider infrastucture companies that are drop downs. These are companies that routinely buy assets from a parent that “drops down” those assets to the company in order to benefit from a lower cost of capital. I don’t like these structures because they are ripe for abuse – it’s hard to have an arm’s length transaction, as observers of SunEdison and the Terraform entities showed us.
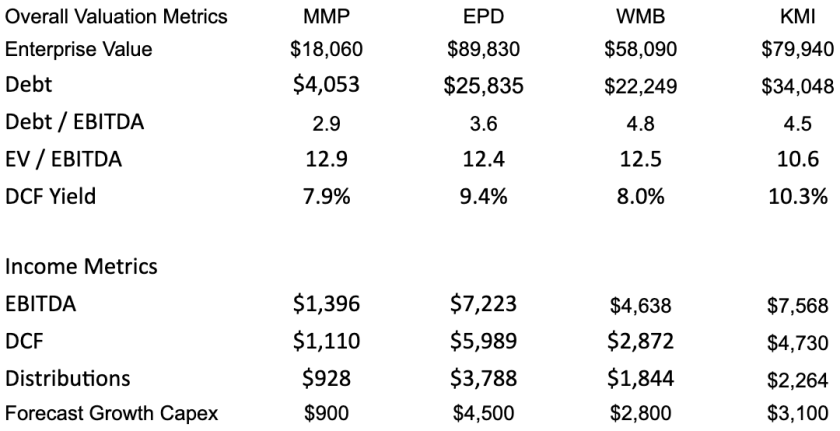
I’ll use four of my favorites - Magellan Midstream Partners, Enterprise Product Partners, Williams Commpanies, and Kinder Morgan - in order to look at valuations for the sector as well as prospective returns. These four companies exhibit all the factors mentioned above, and none of them are dropdowns or burdened by IDRs. I won’t do a deep dive into each of their businesses, but due to their size, I think looking broadly at prospective returns gives investors a good idea for what to expect from energy infrastructure in general.
Here are some relevant financial metrics for each:
We can see that, on average, these companies are trading for ~12x TTM EBITDA. While the DCF yields are a bit different, since you need to consider non-controlling interest, differences in maintenance capital requirements, and capital structure, they also average somewhere in the 8.5-9.0% range.
I value these companies in two parts. First, what is the value of the assets in place? Second, what is a reasonable estimate of the NPV of the growth projects?
Assets In The Ground
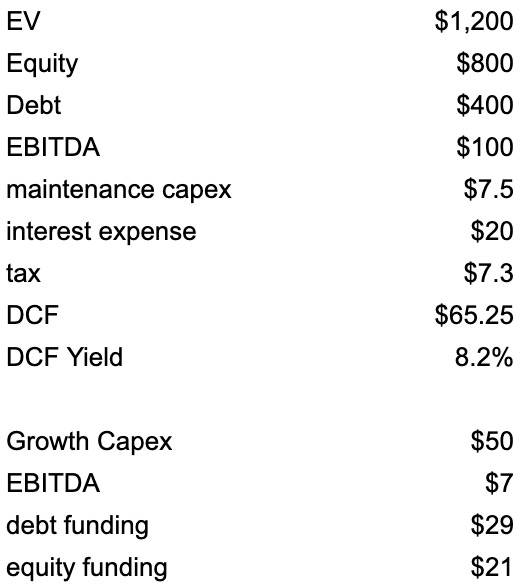
We'll start by examining the value of the assets in the ground. Since these companies trade for ~12x EBITDA, we'll examine what cash flow a collection of these assets would produce at that multiple. Here are the relevant numbers scaled into round numbers to make the analysis easier:
These assets are levered at 4x EBITDA, maintenance capex = 7.5% of EBITDA (in line with the average for these companies), the debt pays 5% annually, and the company pays 10% tax on the sum of EBITDA - maintenance capex - interest expense (the c-corps generally wouldn't pay the full 20% tax rate because of large depreciation expenses and the MLPs don't pay any tax at all).
We can see that at 12x EBITDA and a reasonable leverage profile, an equity owner would have a yield of a bit above 8%. That mostly matches the metrics from the four companies above.
To find a value for these assets, we need a discount rate and some estimate of long-term EBITDA growth. As I mentioned previously, I picked these companies because they're relatively large with diverse sets of valuable assets. Over time, some of these assets will become stranded and see reduced cash flows. As a whole, however, we can reasonably expect a bit of cash flow growth due to higher pricing and probably more volumes as oil and gas production increases in the US over time. To be conservative, you might guess that the cash flows would grow in the 0-2% range over time.
If you apply a 10% discount rate on 0% growth and 2% growth, respectively, you would get a fair value of 10.5x and 12x EBITDA, respectively, for these assets.
Many would argue that in a world of low interest rates, you should apply a lower discount rate. 10% IRRs from stable, long-term assets with lots of cash flow would and do invite competition amongst institutional investors. If you took the discount rate down to 8%, you would have a fair value of 12x and 15x EBITDA at 0% and 2% growth, respectively.
Those that have followed the space know that many pension funds and other institutional investors have been buying some of these assets at EBITDA multiples of 12-14x. Williams, specifically, has sold a few of its assets that are perceived to be of not the highest quality around 14x.
Coming back to the valuations on these companies as a whole, we can see that they look pretty cheap! At 12x EBITDA you would make roughly 10% long-term returns if the underlying earnings stream grows at ~2% annually and if these companies didn't spend anything on accretive growth projects.
Valuing Future Growth
The last piece is to look at the NPV of future growth opportunities. These companies all have large backlogs of accretive growth investments. Importantly, each of these companies is also funding those growth projects with retained earnings.
You aren't running into the previous situation where they're taking leverage and the payout ratio sky-high, paying out every last drop of DCF, then funding the growth with equity issuances. They've taken leverage down, dropped the payout ratios, and are using cash flows to grow.
You can see the guidance for growth capex dollars in the above chart. This capex spend generates roughly mid-teens unlevered ROIs. That comes out to a cost multiple of ~7x of the expected EBITDA generation (i.e. they might have a project that costs $700mm that is expected to generate $100mm of EBITDA, for a 7x EBITDA multiple). If you go back to the previous section, you'll remember that in aggregate these assets are worth something like 12x EBITDA. Obviously, building something at a cost of 7x that is worth 12x is great and quite NPV positive.
Let's go back to our example company to map out the cash flows and growth:
I have again used a composite using roughly the average growth capex numbers for the four companies listed above. If you look at the initial chart, you can see that growth capex averages roughly 50% of EBITDA. With that number, and funding the capex at the same 4x leverage multiple, we get $29mm of debt financing and $21mm of equity financing, with $7mm of EBITDA generation.
There's lots of different ways to find the NPV, but here's the most basic to me. Let's just say that this company can spend $50mm every year with the same cash flow characteristics. That spend will be worth ~12x the $7mm of EBITDA that it generates, or $84mm. Backing out the debt, that's worth $55mm to the equity, and we only had to spend $21mm, so we are creating $34mm of value every year. If the growth capex profile dosn't grow (I do expect it to grow over time), then that's worth $340mm at a 10% discount rate. That's ~3.4 turns of EBITDA that we can add onto our initial valuation of 12x.
You could also do a valuation through a traditional DCF approach. I won't go into too much detail, but if I take DCF, make some assumptions about likely growth capex, and map the cash flows back to the current prices, I get roughly 13-15% IRRs even without multiple expansion, which triangulates nicely to the previous calculation of these stocks looking undervalued at ~12x EBITDA.
However you want to value it, I don't want to miss the forrest for the trees. If you take a step back, these companies are trading ~12x EBITDA. Mapping things out to FCF, we can see that the assets that are currently in the ground are easily worth 12x EBITDA with conservative earnings growth assumptions. Last, each of these companies have large backlogs of very accretive projects that deliver terrific levered equity returns and can be funded with internally generated cash flows, which are probably worth another 3-4 turns of EBITDA. If you were to translate that undervaluation back into IRRs from where we sit today, you would easily get something in the low to mid-teens range.
Risks Going Forward
All of this looks terrific, but didn't these companies blow themselves up a few years ago? What is to say that that won't happen again?
I would never say that stock prices won't be volatile, but these companies look completely different than they did in 2014. Debt levels are lower, payout ratios are lower, growth capex is being funded by retained earnings, corporate governance is much improved, and the assets with the most cyclical cash flows have generally make up much less of the earnings mix than they did previously.
If you assume that EBITDA goes down a bit, then you can see that all of the important financial ratios still look okay. The stocks would go down just like any other, but it won't cause the whole model to blow up. The good news at this point is that the asset mix looks pretty good and we have large secular hydrocarbon growth trends. EBITDA should hold up better than it did during the last energy recession, and the financial structures are on much sounder footing.
The situation actually reminds me a bit of the banks, which went to 30x leverage to 12x. You might have some weakness here or there but such weakness wouldn't cause a crisis because the balance sheets are much stronger.
Conclusion
We started out this piece by asking why the price of energy infrastructure companies crashed so violently and whether there was any value in the sector. We saw a story of aggressive managements, high leverage, and sometimes low quality assets.
After a long shakeout, the current situation is much different. First and foremost, we’ve seen that core assets are still very valuable and are providing good cash flows. Second, leverage and payout ratios have been prudently taken down, so that these companies can internally fund accretive growth projects. Finally, valuations have contracted to the point where many of these companies trade at or below the value of the assets in the ground but the valuations don't reflect the substantial growth opportunities that lay ahead.
Most of the objections that I've seen to these investments have to do with terrible backward-looking results. As long-term, buy-and-hold value investors, it pays to ignore recent performance and look at the business itself. Investors should like what they see.
Disclosure: Pursuant to the provisions of Rule 206(4)-1 of the Investment Advisors Act of 1940, we advise all readers to recognize that they should not assume that recommendations made in the future will be profitable or will equal the performance of past recommendations. This publication is not a solicitation to buy or offer to sell any of the securities listed or reviewed herein. This contents of this publication are not recommendations to buy or sell any of the securities listed or reviewed herein. Investing involves risk, including risk of loss. The contents of this publication have been compiled from original and published sources believed to be reliable, but are not guaranteed as to accuracy or completeness. Kyler Hasson is an investment advisor and portfolio manager at Delta Investment Management, a registered investment advisor. The views expressed in this publication are those of Kyler Hasson and not of Delta Investment Management. Kyler Hasson and/or clients of Delta Investment Management and individuals associated with Delta Investment Management may have positions in and may from time to time make purchases or sales of securities mentioned herein.
[jetpack_subscription_form show_only_email_and_button="true" custom_background_button_color="undefined" custom_text_button_color="undefined" submit_button_text="Subscribe" submit_button_classes="undefined" show_subscribers_total="false" ]


